Disclaimer & Copyright Notices; Optimized for the MS Internet Explorer
Nova Scotia lakes-OECD chlorophyll/inlake phosphorus regressions
Research of the Organization for Economic Co-Operation and Development (OECD)
Soil & Water Conservation Society of Metro Halifax (SWCSMH)
Updated: August 12, 2015 
Comparison
of the regression of the historical lake data in Nova Scotia with the
OECD regression of chlorophyll/inlake phosphorus
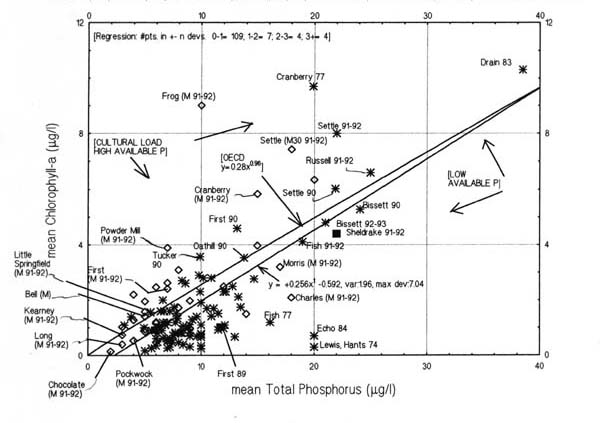
Select published lake data of Nova Scotia
from various references were plotted in Figure-9 below and the
regression derived. In addition the chlorophyll/inlake phosphorus
regression from the OECD (Vollenweider and Kerekes, 1982) was also
plotted in order to ascertain the applicability of the OECD research to
the Nova Scotia case. While the OECD relationships were originally
plotted on a log-log graph, we decided to plot on a linear scale due to
the low relative data range of our Nova Scotia lakes. The source
references of the Nova Scotia lake data are given below the Figure-9.
It can be concluded that the OECD regression of TP/Cha predicts the average lake response, TP/Cha in Nova Scotia with a relative high confidence!
Figure-9:
Comparison between the Nova Scotia lakes and the OECD regressions for
the chlorophyll/inlake phosphorus concentrations:
Data sources:
- Beauchamp, S.T., and
Kerekes, J. 1989. Effects of Acidity and DOC on Phytoplankton Community
Structure and Production in Three Acid Lakes (Nova Scotia). In Water,
Air, and Soil Pollution. 46: 323-333.
- Environment Canada. 1974. Shubenacadie Headwaters Environmental Survey. Sector Report 4. Inland Waters Directorate.
- Hart, W.C., Scott, R.S., and Ogden III, J.G. 1978. A
Phosphorus Loading Model for Lakes in the Shubenacadie Headwaters.
Shubenacadie- Stewiacke River Basin Board. Tech. Rpt. #2, Appendices.
195p.
- Hinch, P.R., and Underwood, J.K. 1985. A Study of
Aquatic Conditions in Lake Echo During 1984. N.S. Dept. Env. iv, 36p.,
Appendices.
- Kerekes, J. 1975. Phosphorus Supply in Undisturbed
Lakes in Kejimkujik National Park, Nova Scotia (Canada). In Verh.
Internat. Verein. Limnol. 19: 349-357.
- Kerekes, J., Freedman, B., Howell, G., and Clifford,
P. 1984. Comparison of the Characteristics of an Acidic Eutrophic, and
an Acidic Oligotrophic Lake near Halifax, Nova Scotia. In Water Poll.
Res. J. Canada. 19(1): 1-10.
- Kerekes, J., Beauchamp, S., Tordon, R., and Pollock,
T. 1986. Sources of Sulphate and Acidity in Wetlands and Lakes in Nova
Scotia. In Water, Air and Soil Pollution. 31: 207-214.
- Kerekes, J.J., Blouin, A.C., and Beauchamp, S.T. 1990.
Trophic Response to Phosphorus in Acidic and Non-acidic Lakes in Nova
Scotia, Canada. In Hydrobiologia. 191: 105-110.
- Mandaville, S.M. 2000.
Limnology- Eutrophication and Chemistry, Carrying Capacities, Loadings,
Benthic Ecology, and Comparative Data. Project F-1, Soil & Water
Conservation Society of Metro Halifax. xviii, Synopses 1, 2, 3, 13, and
14. 210p.
- Mandell, P.R. 1994. The Effects of Land Use Changes on
Water Quality of Urban Lakes in the Halifax/Dartmouth Region. M. Sc.
Thesis, Dalhousie Univ., Halifax. xii, 171p.
- Scott, R.S., Hart, W.C., and Waller, D.H. 1991. Water Quality in the Headwaters of the Shubenacadie River System. 85p.
- Soil & Water Conservation Society of Metro Halifax. 1991. Limnological study of twenty seven Halifax Metro lakes. 136p.
- Soil & Water Conservation Society of Metro Halifax. 1993. Compendium of briefs on 7 Halifax Metro Lakes (Stage-IIA [1991-93] protocol, November, 1993). xiv, 234p.
- Underwood, J.K., and Josselyn, D.M. 1979. The Extent of
Road Salt and Nutrient Stressing of Williams Lake, Halifax, Nova
Scotia. N.S. Dept. Env. 88p.
- Vollenweider, R.A., and Kerekes, J. 1982.
Eutrophication of Waters. Monitoring, Assessment and Control.
Organization for Economic Co-Operation and Development (OECD), Paris.
156p.

We salute the Chebucto Community Net (CCN) of Halifax, Nova Scotia, Canada for hosting our web site, and we applaud its volunteers for their devotion in making `CCN' the best community net in the world