Disclaimer & Copyright Notices; Optimized for the MS Edge & Firefox
Modified: July 06, 2016
![]()
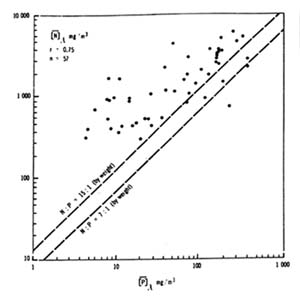
![]() Generally, lakes are phosphorus limited with
Total-N/Total-P ratios >15, and nitrogen limited for Total-N/Total-P
ratios <7. For ratios of Total-N/Total-P between 15 and 7, either P
or N, or both P and N could be limiting (cf. Figure-1).
Generally, lakes are phosphorus limited with
Total-N/Total-P ratios >15, and nitrogen limited for Total-N/Total-P
ratios <7. For ratios of Total-N/Total-P between 15 and 7, either P
or N, or both P and N could be limiting (cf. Figure-1).
The tendency for nitrogen and phosphorus to increase in parallel makes it difficult to determine the relative importance of the two factors in the eutrophication process. Accordingly, it is impossible to speculate solely on the basis of nutrient conditions found in a lake, which one of the two factors is limiting production. This question can only be resolved by careful analysis of all pertinent information.
For both cases, individual lakes may be at variance with the rule. The importance of these trends is that, with increasing trophy a correspondingly higher fraction of easily metabolized mineral components become available for algal growth. In part, this greater availability depends on the metabolic processes taking place in the lake, but it is also due to a correspondingly greater supply of these components in culturally eutrophied lakes, i.e., depending on the sources causing eutrophication.
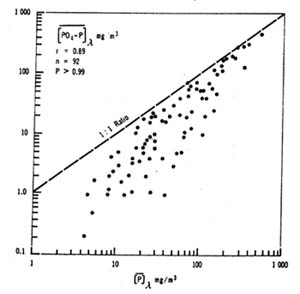
In management terms, these findings mean that the control of sources of nitrogen and phosphorus of high biological availability (dissolved mineral fractions) probably have a greater effect on the reversal of eutrophication than an unselective control, though equal in relative terms, of all sources. In other words, priority is to be given to control of biologically readily available components. The following Figure can be used for assessment purposes (Kerekes, 1983).
![]()

We salute the Chebucto Community Net (CCN) of Halifax, Nova Scotia, Canada for hosting our web site, and we applaud its volunteers for their devotion in making `CCN' the best community net in the world